
Model Context Tool Inspector
August 25, 2026 · 6 min read
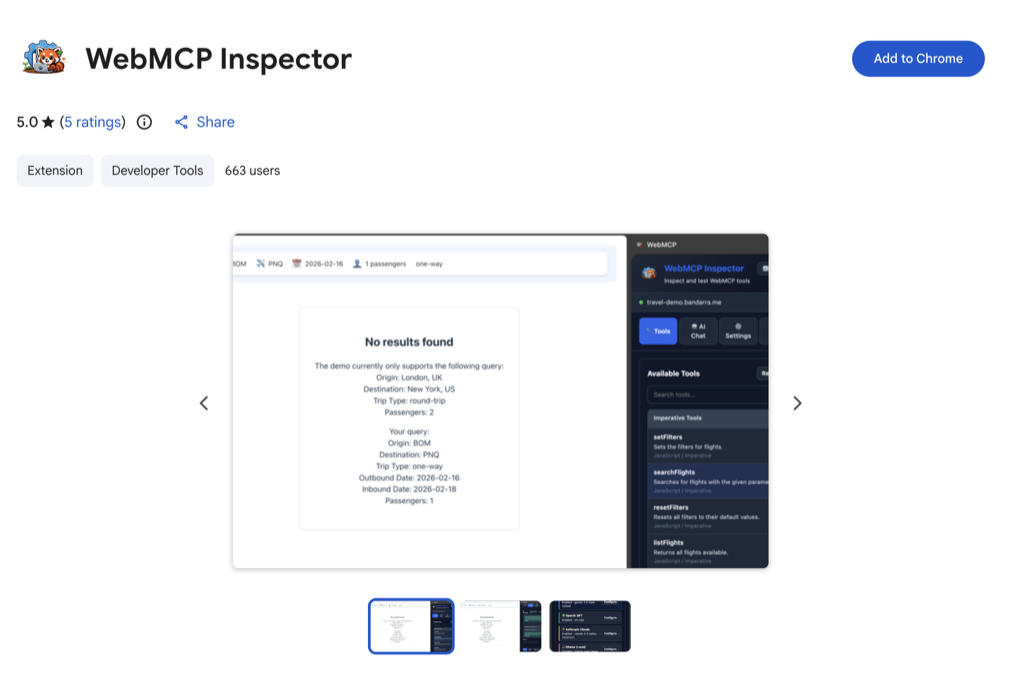
The Model Context Tool Inspector is a Chrome DevTools extension that shows you every WebMCP tool registered on the current page — and lets you execute each one with custom inputs. If you're building or testing in-browser AI-agent tools, it's the fastest way to see exactly what an agent sees. This guide covers what it does, how to install it, and how to point it at xNotePadAI.
What It Is
WebMCP lets a web page expose tools to an AI agent through the browser's document.modelContext API. The catch during early preview: there's no built-in UI to see those tools. The Inspector fills that gap — it reads the registered tools off the page and renders them in a dedicated DevTools panel, complete with names, descriptions, schemas, and a run button.
Discover — lists all WebMCP tools on the active page
Inspect — shows each tool's description, input schema, and read/write hint
Execute — run any tool with your own parameters and see the structured result
What You Need
Chrome Canary or Beta (146+)
WebMCP isn't in stable Chrome yet — you need a preview channel.
The WebMCP flag enabled
Turn on the experimental API in chrome://flags.
The Inspector extension
Free, from the Chrome Web Store. Adds a DevTools tab.
A secure-context page
WebMCP needs a secure context — HTTPS, or localhost (which counts as secure). Plain HTTP on a remote host won't work.
Step 1 — Enable the WebMCP Flag
In Chrome Canary or Beta, open chrome://flags, search for WebMCP, set the flag to Enabled, and relaunch. The direct link is:
chrome://flags/#enable-webmcp-testingTo verify, open any HTTPS page, open the console, and check that the API is present:
!!document.modelContext // true means WebMCP is activeNote: In recent Chrome builds the API lives on document.modelContext. Older preview builds used navigator.modelContext, which is now deprecated. If one returns undefined, try the other.
Step 2 — Install an Inspector
Several community-built inspectors do the same job. Two well-known ones:
Model Context Tool Inspector
The original, by François Beaufort (a Chrome developer advocate). Open source on GitHub.
WebMCP Inspector
A popular alternative (shown in the screenshot above) with a side-panel UI and AI-chat mode. Search the Chrome Web Store to find the current listing.
1. Install one from the Chrome Web Store (Add to Chrome → confirm).
2. Open DevTools (F12) and select the inspector's tab (click the » overflow if it isn't visible). Some inspectors use a side panel instead of a DevTools tab.
Heads up: a WebMCP inspector can read every tool that any page you visit registers. Only install one you trust, and review the publisher and permissions before adding it — as with any browser extension.
Step 3 — Inspect a Page's Tools
With the flag on and the Inspector installed, navigate to any WebMCP-enabled site. Google publishes a live flight-search demo that registers tools like searchFlights and setFilters. Open the Inspector panel, pick a tool, enter parameters, and click Execute — you'll see the structured JSON response an agent would receive.
Trying It With xNotePadAI
xNotePadAI registers 5 in-browser WebMCP tools on its app page. Open the app with the flag enabled and the Inspector shows:
create_note
Create a note (write)
search_notes
Find notes by text (read)
list_notes
List recent notes (read)
get_note
Read one note by id (read)
add_tag
Tag a note (write)
The tools run on the app page, where your notes live. If you've turned on encryption, unlock the notebook first — the tools operate on the decrypted, in-browser copy, so a browser agent can read and write real content while our servers never see plaintext. That's the privacy edge a server-only note app can't match. If you prefer the console, you can drive the same tools by hand on the app page:
const tools = await document.modelContext.getTools();
const t = tools.find(x => x.name === "create_note");
await document.modelContext.executeTool(
  t,
  '{"title":"Made by an agent","content":"Hello from WebMCP"}'
);
📚 Dig Deeper
Troubleshooting
| Issue | Fix |
|---|---|
document.modelContext is undefined | Confirm the flag is Enabled and Chrome was relaunched. |
| No tools appear for your site | Check you're in a secure context (HTTPS or localhost) and there are no JS errors blocking registration. |
| Inspector tab not visible | Click the » overflow tab at the right of the DevTools tab bar. |
executeTool rejects the tool name | Pass the tool object from getTools(), not its name string. |